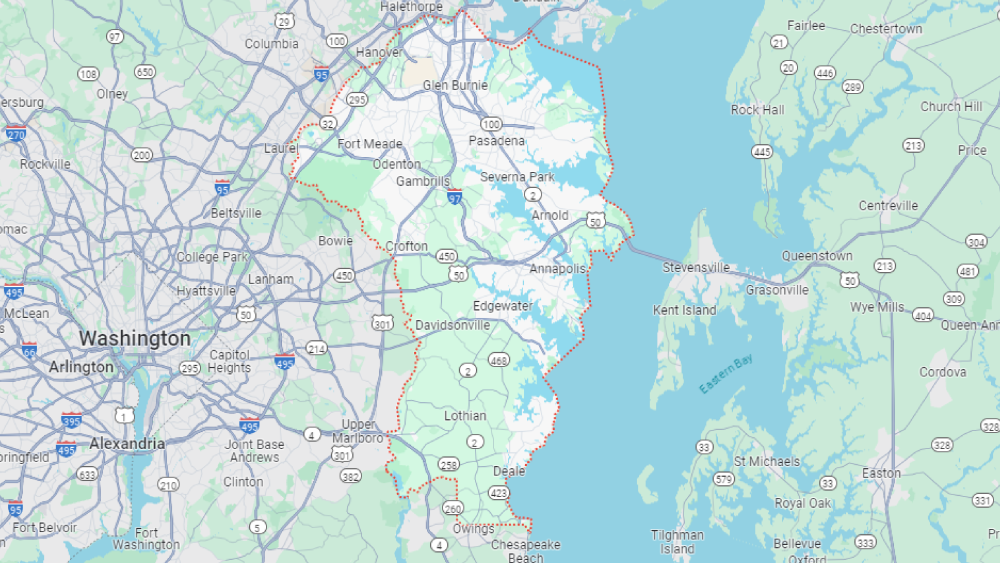
Market Data
The graphics below provide insights into key real estate market indicators in Anne Arundel County, MD, comparing recent data to long-term averages. The dials display metrics such as active listings, new pendings, closed sales, and month of supply for the previous month, alongside their respective five-year averages. This comparative analysis offers valuable context for understanding current market conditions, including inventory levels, buyer demand, and sales activity. Whether you’re a prospective buyer, seller, or industry professional, these visuals provide a comprehensive overview of the local real estate landscape, aiding informed decision-making in navigating the market.
Market Activity (Closed Sales / Active Listings)
This line graph provides a comprehensive overview of market activity in Anne Arundel County, MD, over the past year. It tracks the number of closed sales and active listings on a monthly basis, allowing you to observe fluctuations and trends in the real estate market over time. By visualizing changes month by month, this graphic offers valuable insights into the dynamics of supply and demand, aiding in understanding the evolving landscape of the local housing market.
Months Of Supply
This line graph presents an overview of the months of supply in Anne Arundel County, MD, over the past year. It tracks the number of months it would take to sell all current inventory based on the current sales pace, offering insights into the balance between supply and demand in the local real estate market. By visualizing changes month by month, this graphic helps stakeholders understand fluctuations in market conditions, providing valuable context for both buyers and sellers in navigating the dynamic real estate landscape.
Your Home’s Value
If you would like to know your Home’s Value for FREE, go to: https://headforhome.kw.com/home-value


